
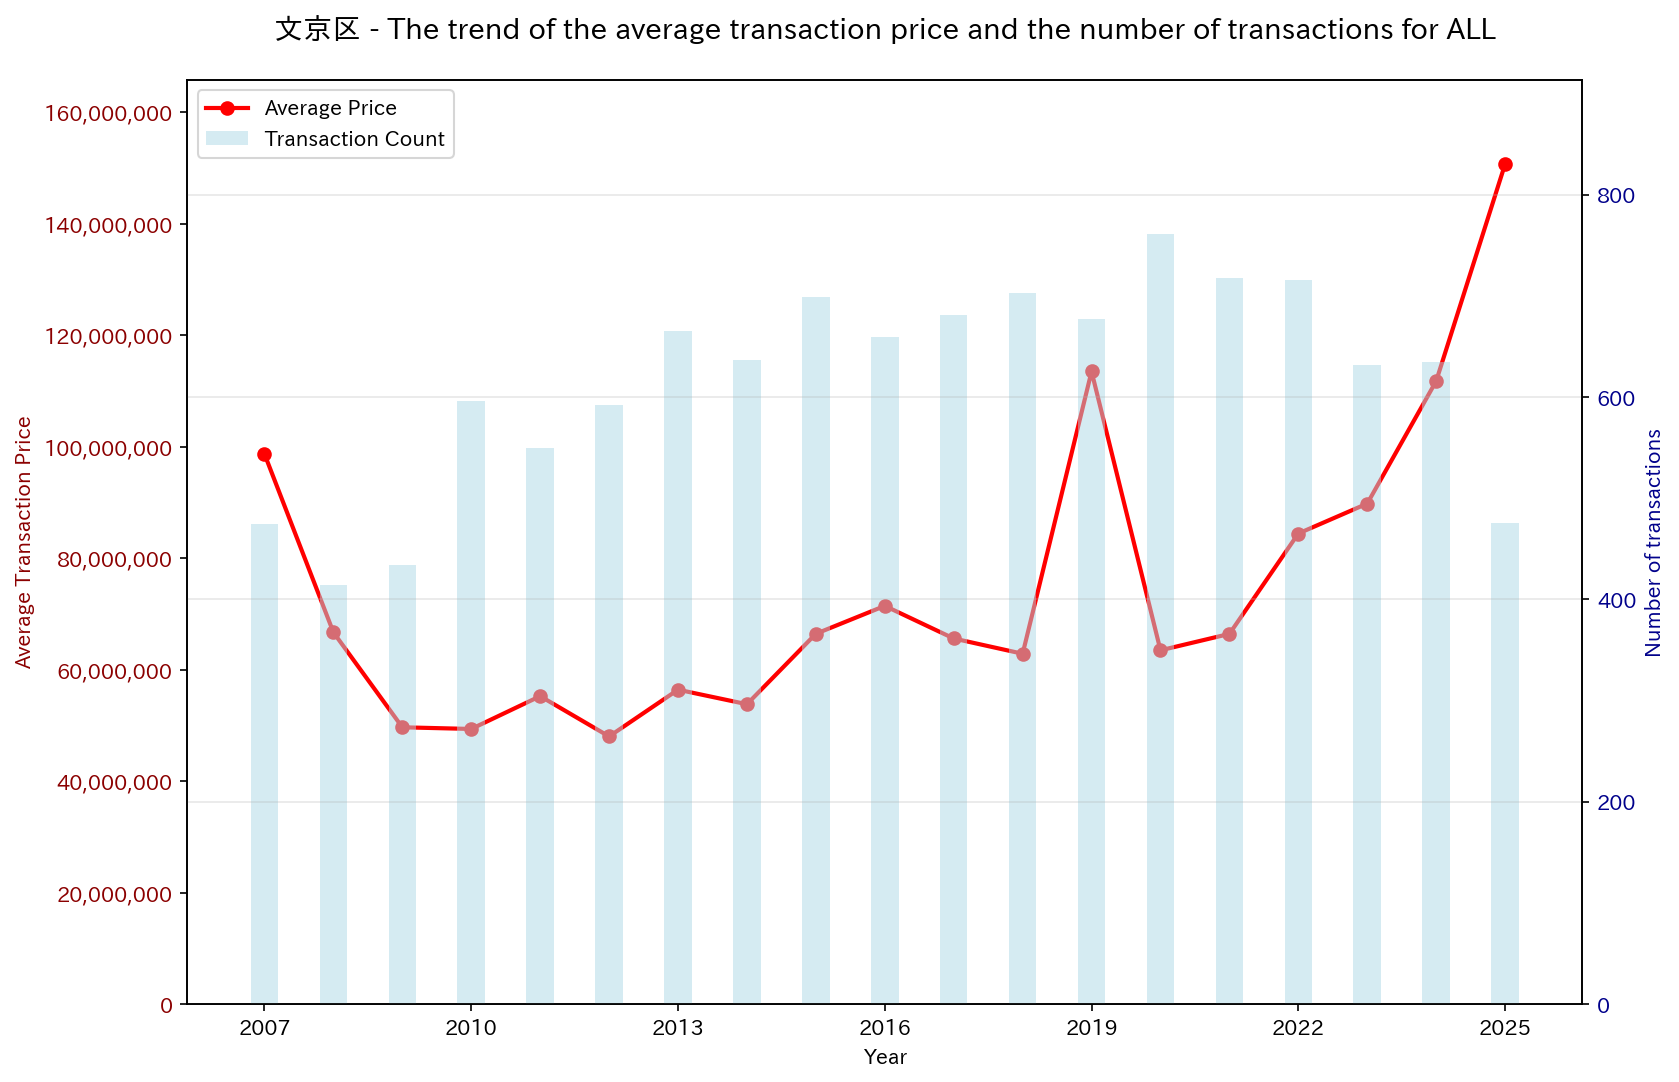
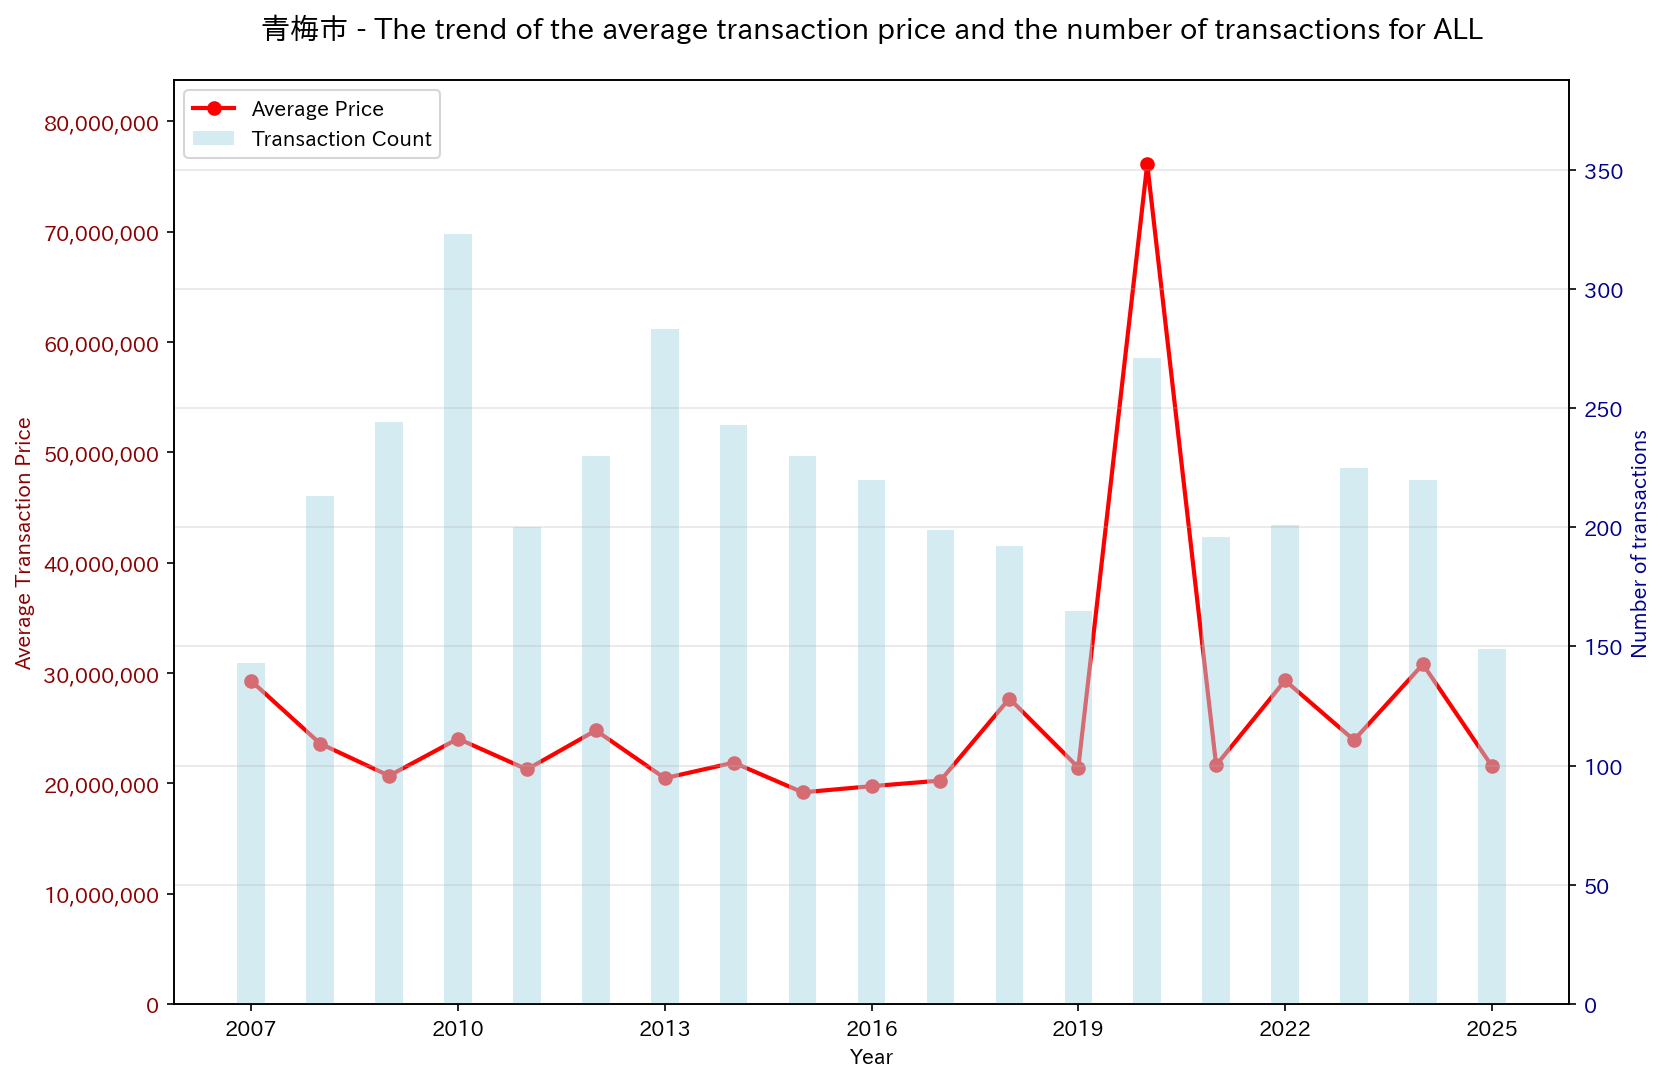
We analyzed the trend of used real estate prices in Tokyo by area and number of rooms.
You can see the fluctuation of real estate prices in each region by year. This information is valuable for those considering purchasing or investing in real estate in Tokyo.
※Data source: Real Estate Information Library (Ministry of Land, Infrastructure, Transport and Tourism)
In 2025, the average transaction price for Chiyoda City overall (the All chart) appears to be slightly lower than in 2024. However, the room-type charts (3LDK, 2LDK, 1LDK, and 1K) show that average transaction prices rose sharply in every individual category.
This is because the number and average price of large building and land transactions, which can reach hundreds of millions to tens of billions of yen and are classified as "Other", declined in 2025. In the weighted average calculation, that dragged down the overall average significantly. This is a statistical effect known as Simpson's paradox. The underlying residential condominium market price trend remains very strong across all room types.


Analysis of used real estate price trends in Tokyo by area and room type. You can see the fluctuation of real estate prices in each region by year.

Analysis of used real estate price trends in Kanagawa Prefecture by area and room type. You can see the fluctuation of real estate prices in each region by year.

Analysis of used real estate price trends in Chiba Prefecture by area and room type. You can see the fluctuation of real estate prices in each region by year.

Analysis of used real estate price trends in Saitama Prefecture by area and room type. You can see the fluctuation of real estate prices in each region by year.

Analysis of used real estate price trends in Osaka Prefecture by area and room type. You can see the fluctuation of real estate prices in each region by year.

Analysis of the used real estate price trends in Aichi Prefecture by area and room type. You can see the fluctuation of real estate prices in each region by year.